r00t.cz
Tianwen-1 Mars mission
Big thanks goes to Paul from UHF-SATCOM for providing me recordings of this signal.
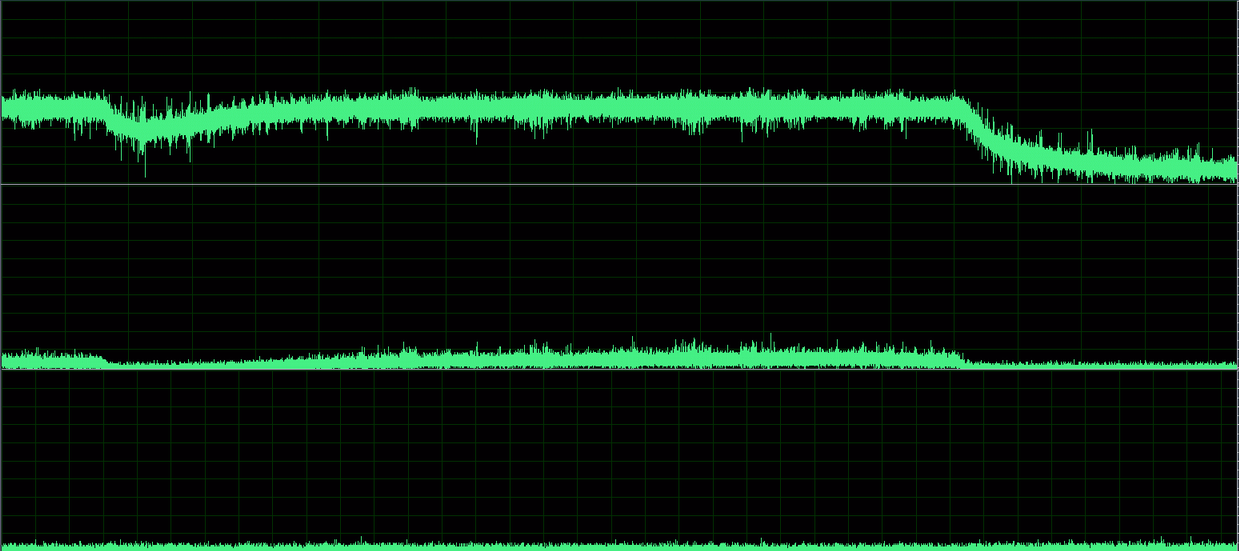
Basic telemetry X-band signal spectrum:
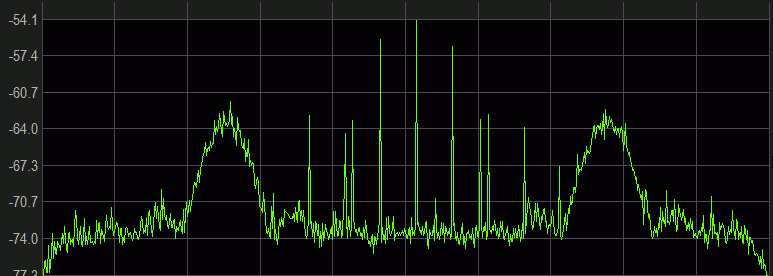
Signal consists of unmodulated PM carrier with multiple subcarriers:
- telemetry downlink on 65536 Hz, 16384Bd BPSK
- telecommand loopback on 8000 Hz, 2000Bd BPSK

High speed QPSK downlink
Modulation can be switched to QPSK and also higher modulation rate of 2.048Mbd Structure stays the same, however frame length of 8192 bits can be used for more efficient burst error correction. Switching procedure usually looks like this:
- PM with telemetry on BPSK sideband
- QPSK 8192Bd low rate data
- QPSK 2048000Bd high rate with 2048 bit frames
- QPSK 2048000Bd high rate with 8192 bit frames
Telemetry downlink parameters
Telemetry downlink is BPSK or QPSK modulated, then coded according to CCSDS with 1/2 convolutional code followed by one block of Reed Solomon. Interestingly the dual-basis (Berlekamp) data representation is NOT used for RS as described by CCSDS 131.0 blue book, making this downlink almost CCSDS compatible, but not exactly.
Parsed CCSDS transfer frame headers showing various data multiplexing:
Ver2 Sc52 VCh1 frm#00AD16 Re0 [030 2C4DF9308 4011]  Lander
Ver2 ScF5 VCh1 frm#016660 Re0 [014 F10552D41 4AAA]  Main probe
Ver2 ScF5 VCh3 frm#00B86C Re1 FILL                  Replay
Ver2 ScF5 VCh1 frm#016661 Re0 [014 F105540C8 4AAA]  Main probe
Ver2 Sc52 VCh1 frm#00AD17 Re0 [030 2C5DF9308 4011]  Lander
Ver2 ScF5 VCh1 frm#016662 Re0 [014 F10555450 4AAA]  Main probe
Ver2 ScF5 VCh1 frm#016664 Re0 [014 F10557B5F 4AAA]  Replay
Ver2 ScF5 VCh3 frm#00B86E Re1 FILL                  Main probe
Ver2 ScF5 VCh1 frm#016665 Re0 [014 F10558EE7 4AAA]  Lander
Ver2 Sc52 VCh1 frm#00AD19 Re0 [030 2C7DF9308 4011]  Main probe
Resulting 2048 bit frames use AOS Transfer frame format version 2. Spacecraft ID is 0xF5 for main probe and (presumably) 0x52 for lander. Downlink capacity is split so 0xF5 virtual channel 1 downlink gets 50%, lander with s/c id 0x52 and also virtual channel 1 25% and remaining 25% is reserved for data playback from main probe using virtual channel 3 (this haven't been seen active yet). AOS transfer frame data field is 8 bytes long and contains timestamp (2 bytes day, 4 bytes time in 0.1ms resolution, 2 bytes of flags/unknown). Looking at the APID packets, multiple active APIDs can be seen. While lander APIDs consists mostly of static data (presumably it's in hibernation now), main spacecraft data are more interesting with about 50 APIDs active.
Virtual channels in use
- VC1 - Basic telemetry downlink for both main s/c and lander
- VC2 - Memory dump data
- VC3 - Idle/fill
- VC4 - Recorded frames downlink when played back
List of all active APIDs:
All as hexadecimal numbers. Apparent instrument grouping:
Main (S/C ID 0xF5):
- 0C0 0C2 0C4 0C6 0C8 0CA 0CC 0CE
- 0D0 0D2 0D4 0D6
- 1C0 1C1 1C2 1C3 1C4 1C6 1C7 1C8 1C9 1CA 1CC 1CD 1CE
- 2A0 2C0 2E0
- 300 340
- 400 401 402 403 404
- 500 501 502 503 504 505 506 507 508
- 540
- 550
- 600 601
Lander (S/C ID 0x52):
- 001 002 005 00F
- 030
- 081 082 083
- 088
SC 0xF5 APID 0x507
Most interesting is APID 0x507 that contains current spacecraft position (presumably used for HGA antenna pointing and general orientation) in double precision floating point values. This data is in XYZ format in kilometers and with deltas for each axis. Origin is the sun center. Timestamp for the data is also included. This APID is sent every 32 seconds. This is probably output from on board computer to make sure calculated position from uploaded orbital parameters is correct. It's output every 32 seconds, time is on board time.
Sample data:
2020-07-25 07:37:04.381  77395324.623705 -120028596.942956 -52029631.885987 31.179136 15.128088 7.490056
2020-07-25 07:37:36.382  77396322.143351 -120028112.790527 -52029392.206920 31.164092 15.130745 7.489563
2020-07-25 07:38:08.383  77397319.187608 -120027628.552638 -52029152.543120 31.149230 15.133334 7.489055
2020-07-25 07:38:40.383  77398315.752926 -120027144.235999 -52028912.897277 31.134548 15.135857 7.488534
2020-07-25 07:39:12.385  77399311.882344 -120026659.824552 -52028673.260826 31.120041 15.138314 7.488001
2020-07-25 07:39:44.386  77400307.522297 -120026175.349102 -52028433.648397 31.105707 15.140709 7.487454
2020-07-25 07:40:16.387  77401302.706282 -120025690.798014 -52028194.053632 31.091543 15.143042 7.486897
No jumps in this data were recorded so far, suggesting no further trajectory changes were made. At least not during receive window when probe was received and monitored.
Daniel Estévez did rest of the work and figured out how to convert these values into proper orbital parameters that can be used for tracking. Here is his post on this matter: Tracking Tianwen-1’s orbit to Mars - Part I and Part II.
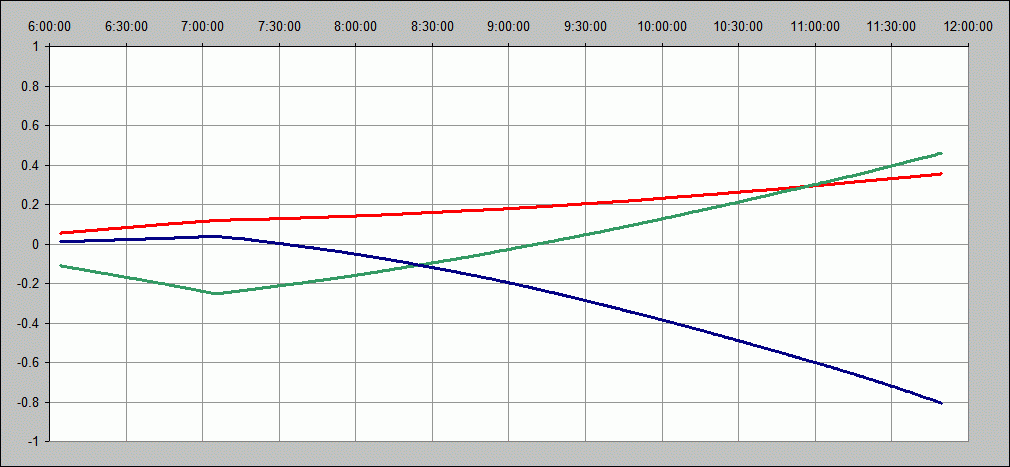
SC 0xF5 APID 0x508
Another set of 3 double precision floating point numbers is in APID 0x508. This APID was all zeroes after the launch, but now that HGA antenna is active, it contains changing values. It's possible this is related to antenna pointing.
Sample data:
2020-07-28 06:04:26.678    0.05537931  -0.11061775   0.01207578
2020-07-28 06:04:58.677    0.05590598  -0.11188689   0.01212990
2020-07-28 06:05:30.678    0.05650580  -0.11322205   0.01238454
2020-07-28 06:06:02.678    0.05702552  -0.11443835   0.01252264
2020-07-28 06:06:34.678    0.05768363  -0.11565406   0.01280456
2020-07-28 06:07:06.678    0.05822844  -0.11687843   0.01304913
2020-07-28 06:07:38.678    0.05881313  -0.11812509   0.01324488
2020-07-28 06:08:10.678    0.05930242  -0.11927183   0.01337117
2020-07-28 06:08:42.678    0.05994636  -0.12041693   0.01362147
Graphed values for entire visibility window of 2020-07-26:
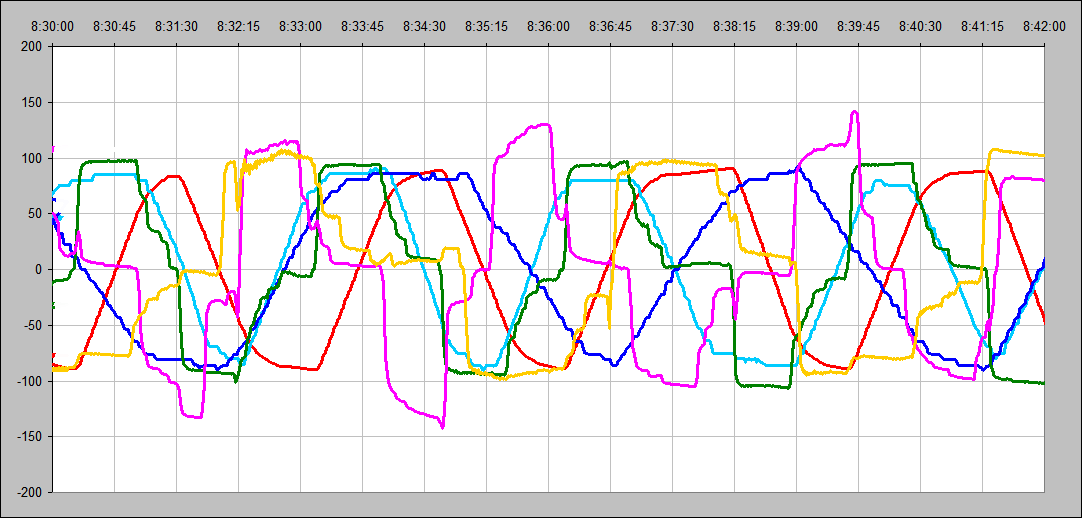
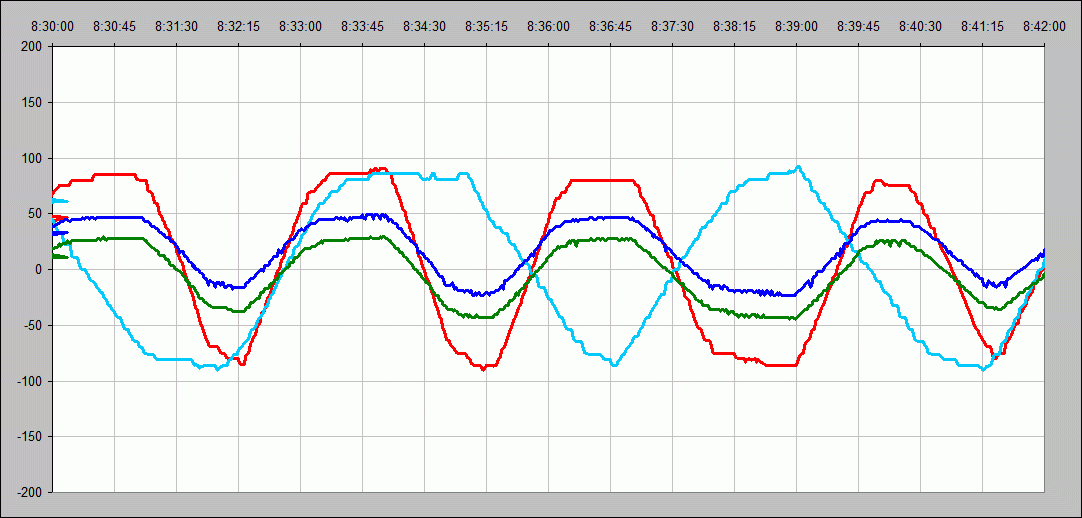
SC 0xF5 APID 0x500
This APID probably contains solar sensor data, formatted as 16bit signed integers. Next day after the launch, spacecraft was clearly rotating as can be clearly seen on the following graphs:
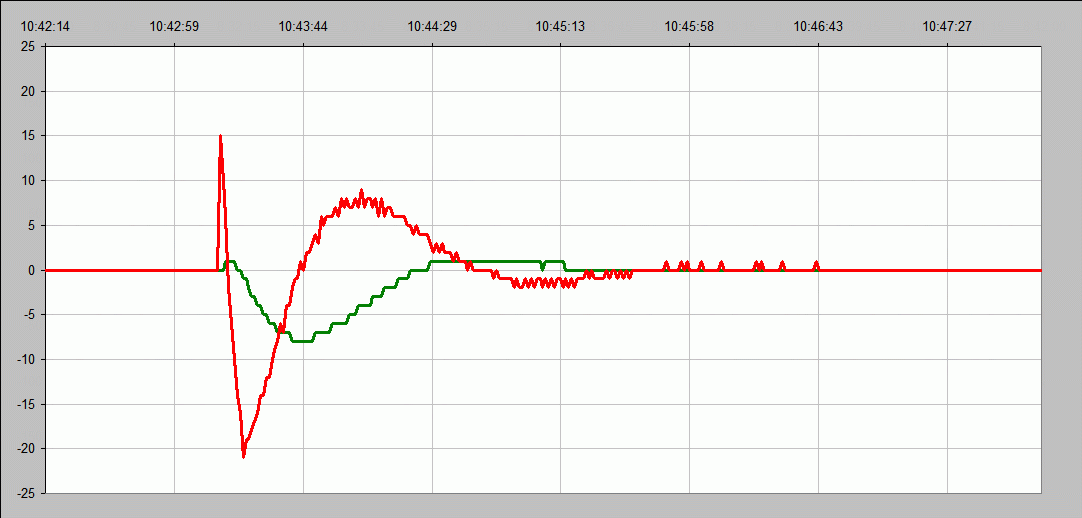
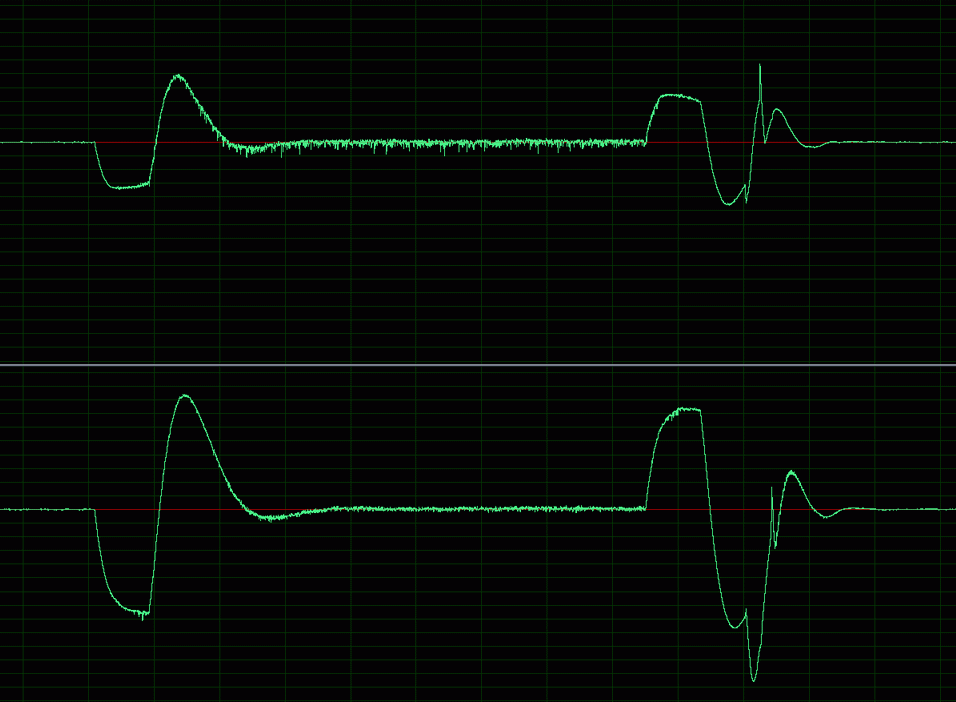
Now that HGA antenna is in use, rotation have stopped and the same values flatlined. However small repetitive blips can be seen, probably caused by a propulsion system keeping orientation correct:

Detailed look at one peak, showing reaction to the impulse:
SC 0xF5 APIDs 2 & 3
These are statuses from two redundant command decoders. First byte is count of decoded commands, it increases for every command received by the spacecraft. Together with observing the spectrum if uplink bursts can be seen, this is a handy indicator that probe is in direct communication with mission control center.
SC 0xF5 APID 0xC8
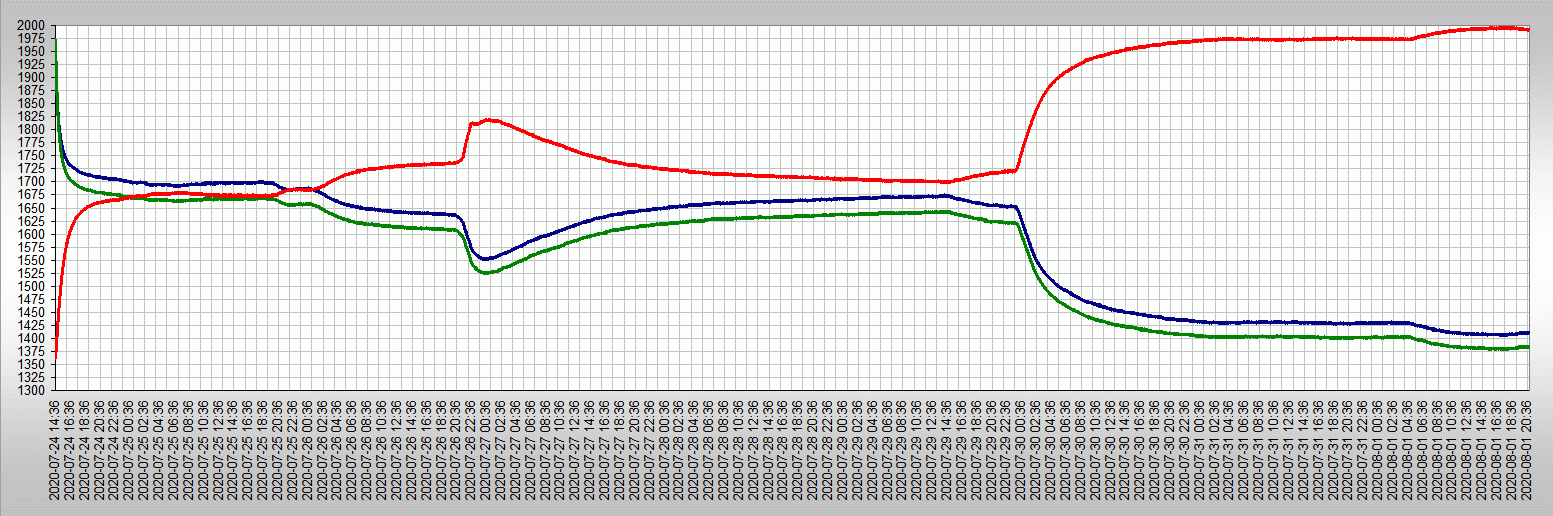
This APID seems to contain solar array telemetry. Data are sent as 16bit unsigned values and probably have to be scaled to get proper calibrated values. But even plotting raw data is telling:
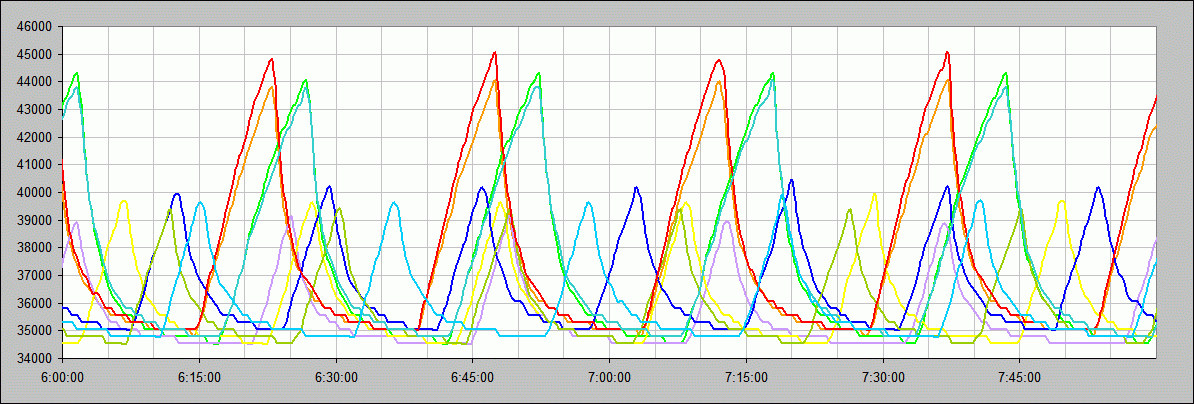
Seems like rotation haven't stopped, it just slowed down a lot. Based on the above graph, one rotation takes about 25 minutes.
SC 0xF5 APIDs 0x300 and 0x340
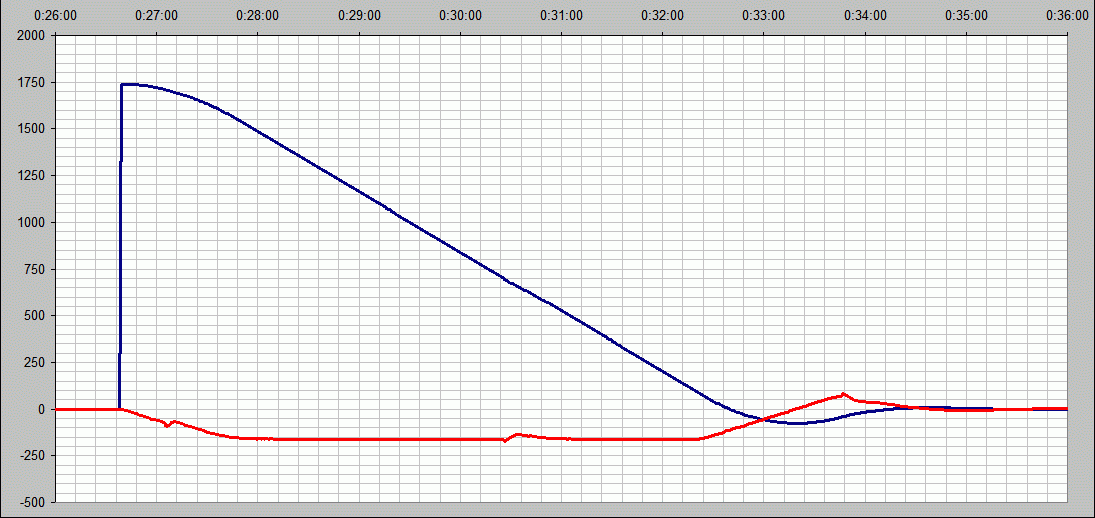
These are data from two redundant receivers. Uplink carrier lock status and measured signal strength is encoded here.
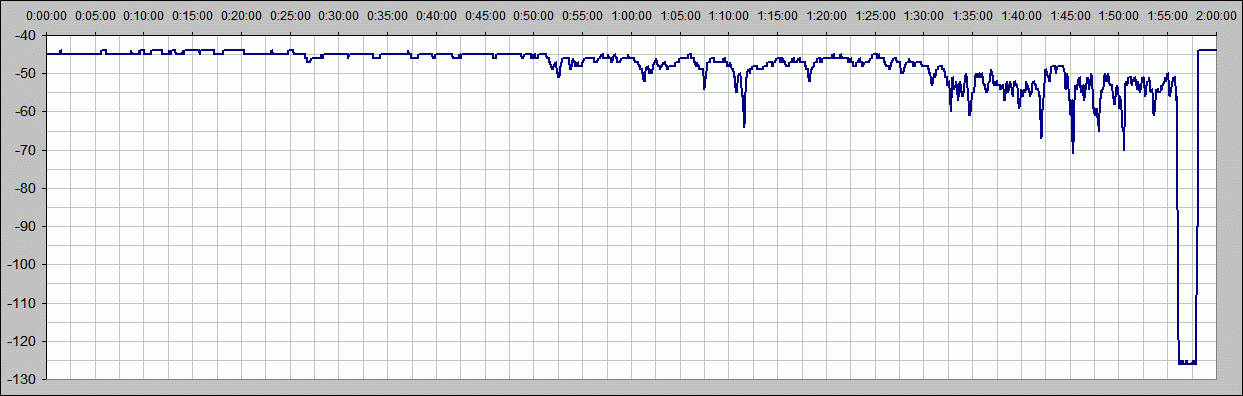
This graph shows plotted signal strength. Ground station probably have s/c at very low elevation and signal starts getting weaker. Then it unlocks and then locks to the different ground station.
High data rate downlink contents
It includes all realtime basic telemetry APIDs as described above and high volume data downloads or idle frame fill. All of low rate virtual channels are used, ie:
- VC1 - Basic telemetry downlink for both main s/c and lander
- VC2 - Memory dump data
- VC3 - Idle/fill
- VC4 - Recorded frames downlink when played back
VC19
Contains download of custom (non-CCSDS) formatted data, with variable length packets starting with 0x7EB51C3F. There are two types of these packets, determined by length:
1064 byte packets
These contain header and the data, it looks like 8 bit sampled values of something. First block is 504 bytes long and second is 488 bytes long. Second block have "peak" in the middle, possibly indicating this is frequency spectrum. No absolute timestamps are included, so it's hard to guess the sampling interval and time frame.
4152 byte packets
These looks like statuses for the instrument and possibly calibration (1024 32bit values)
VC23
Again custom packetized format. Frames start with 0xEB90 and have fixed length of 649 bytes. Contents can be split into these sections:
- Header, with packet counter
- 54x 16bit values, counts of something
- 23 blocks of 22 bytes (channels of something) composed of 16 bit values
My guess is this is charged particle detector (or simply proportional "geiger" counter) telemetry. The initial values are counts in bins of energies, followed by some compressed data of actual peak values. The count values decrease for higher channels as you would expect less higher-charged particles. Plotting the data of first 3 counts results in following graph:
Slow changes might be due to sun orientation.
VC24
Most interesting of all so far is virtual channel 24. It again contains custom packetized format, starting with 0xEB90. Multiple packets are present, sent at different rates, differentiate by data length:
- Length 92
Here is the 80 hours of XY accelerometer data as audio file (sped up by 5000x): tianwen1_80hours.mp3 (495kB)
- Length 24
- Length 54
- Length 74
- Length 174
- Length 70
And this is a huge dump of data, based on timestamps it's from 2020-07-24 14:36 to 2020-08-01 20:54 ! Better analysis of this data coming soon...
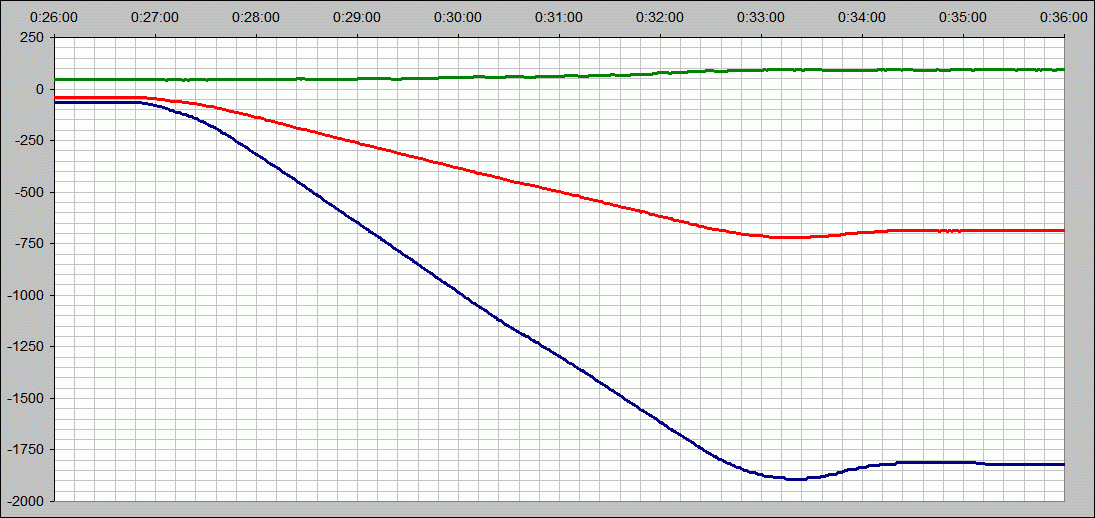
Trajectory correction maneuver 1 preparation burn on 2020-07-30
Spacecraft performed test burn for planned TCM-1 starting at 23:25:00. Burn itself should happen around 2020-08-01.
In preparation for possible fail-safe scenarios, downlink was switched to LGA antenna. Later data from maneuver time-frame were downloaded using high rate downlink.
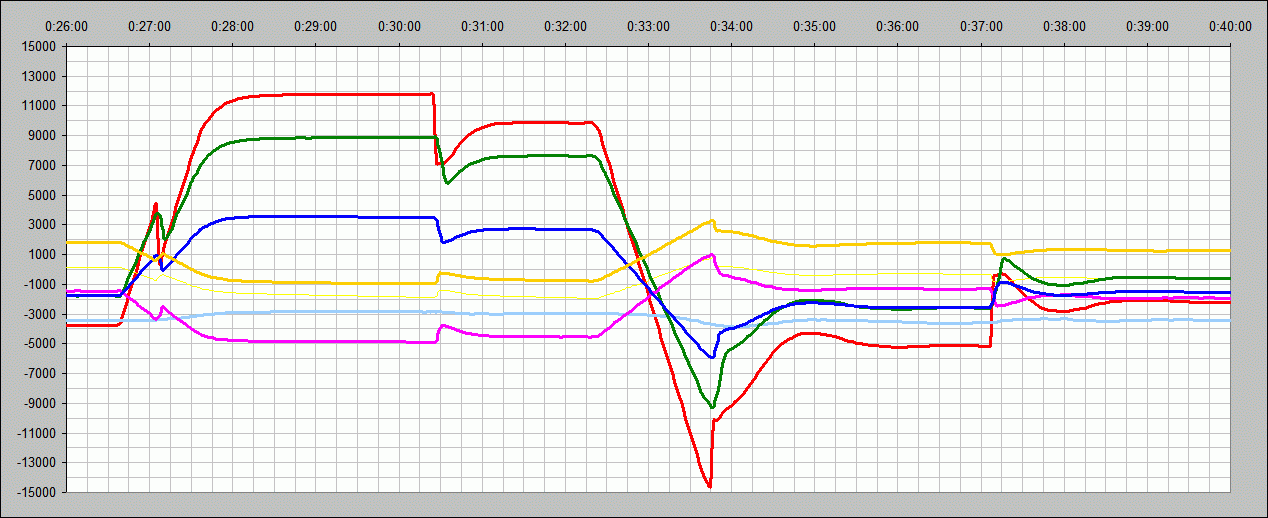
Following are some graphs of possibly accelerometer data. Exact value scaling is hard to guess, but data still make a nice graphs. All data were extracted from APIDs 0x500,0x501,0x502:
All content on this webpage is published for personal use only.
You are using any software downloaded from this page at your own risk. Some software may be illegal to use in your country.
© r00t 2009-2021 (email: r00t@<this domain>)